

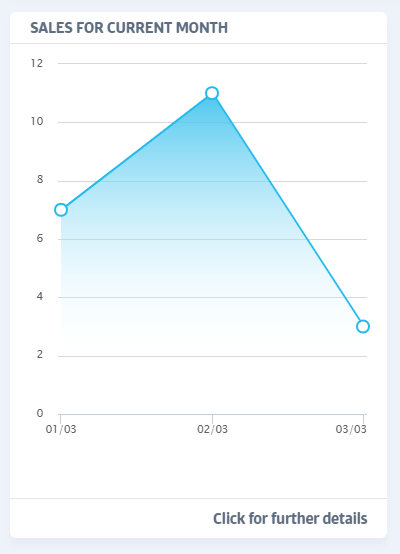
A. The KPI circles can include transferred members as well as added members; the Sales widget will just give an overview of sales for the month-to-date; the height of the graph scales to suit the highest number of sales (per day) for the period, and each day's sales figure is plotted across the horizontal axis of the graph.
In the event there have been no sales for the current month so far, you will see a message and a link to allow you define some membership packages to potentially stimulate your sales.
Comments
0 comments
Please sign in to leave a comment.